Design:
Research Question: What is the relationship between the position of a buggy car and the time it is running?
To determine the position of the buggy, we have to have a designated initial point and test the position of the buggy during different time intervals. We will use a variety of time intervals, every half second until 5 seconds, which means eleven different time intervals. In order to get well-rounded data, we will test the position of the buggy three different ways: stopwatch, motion sensor, and video analysis.
To determine the position of the buggy, we have to have a designated initial point and test the position of the buggy during different time intervals. We will use a variety of time intervals, every half second until 5 seconds, which means eleven different time intervals. In order to get well-rounded data, we will test the position of the buggy three different ways: stopwatch, motion sensor, and video analysis.
Variables:
Independent Variable: Time (sec)
Dependent Variable: Position (cm)
Controlling Variable(s): Type of buggy, riding track, and starting height
Dependent Variable: Position (cm)
Controlling Variable(s): Type of buggy, riding track, and starting height
Lab Materials + Setup:
Buggy
Cart Track (minimum 2 meters)
Motion Sensor + LabQuest Mini
iPhone (Stopwatch + Video Camera)
Computer (LoggerPro)
Cart Track (minimum 2 meters)
Motion Sensor + LabQuest Mini
iPhone (Stopwatch + Video Camera)
Computer (LoggerPro)
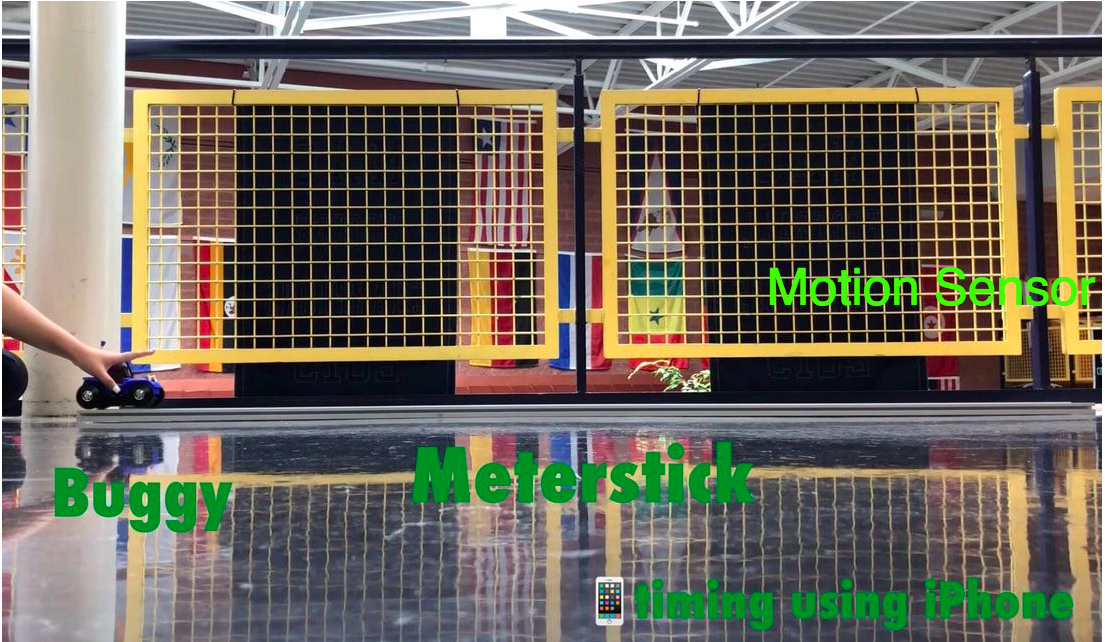
This photo was adapted by fellow lab partners who worked in the exact same environment as my lab partner and I.
| Video Analysis Buggy |
This is a video from video analysis that shows how the experiment was set up.
Procedures:
Stopwatch (Trial 1):
Step 1: Place the buggy on the cart track in which the buggy is sat right behind the 20cm line. The 20cm will be considered our initial point at 0cm for all trials.
Step 2: Start the timer on the stopwatch and turn on the buggy at the same time.
Step 3: Stop the timer once it reaches 0.5sec, and be very precise and accurate with the data collection.
Step 4: Repeat steps 1-3 for every 0.5sec interval until 5sec.
Motion Sensor (Trial 2):
Step 1: Plug the Motion Sensor into the LabQuest Mini and then plug the LabQuest into the computer.
Step 2: Place the Motion Sensor on the start of the cart track so that the buggy drives away from it.
Step 3: Place the buggy on the track at the 20cm line, which will be considered our initial point at 0cm.
Step 4: Open up LoggerPro on the computer and make sure there are two sets of graphs.
Step 5: Start the trial on LoggerPro and turn on the buggy at the same time.
Video Analysis (Trial 3):
Step 1: Place the buggy at an initial point on the meter stick.
Step 2: Set up the camera to the side of the track to show the movement of the buggy from left to right.
Step 3: Record a video of the buggy going across the screen and make sure the buggy starts and ends off screen.
Step 4: Import the video onto LoggerPro and use it for video analysis.
Recorded Raw Data:
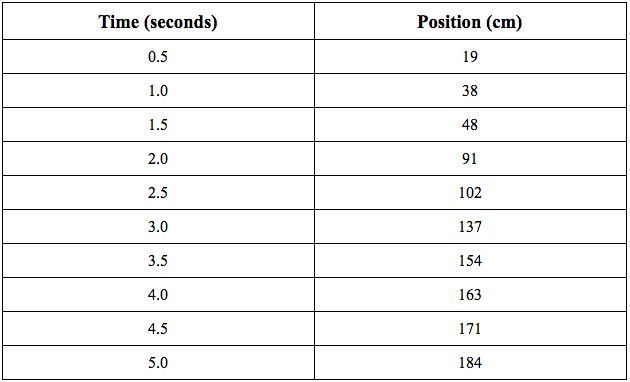
This is also presenting the processed raw data as the data collected provides the measurements needed. The measurements for the motion sensor and video analysis trials can only be presented in processed raw data and therefore were not included in this section.
Graphical Analysis:
Stopwatch (Trial 1):
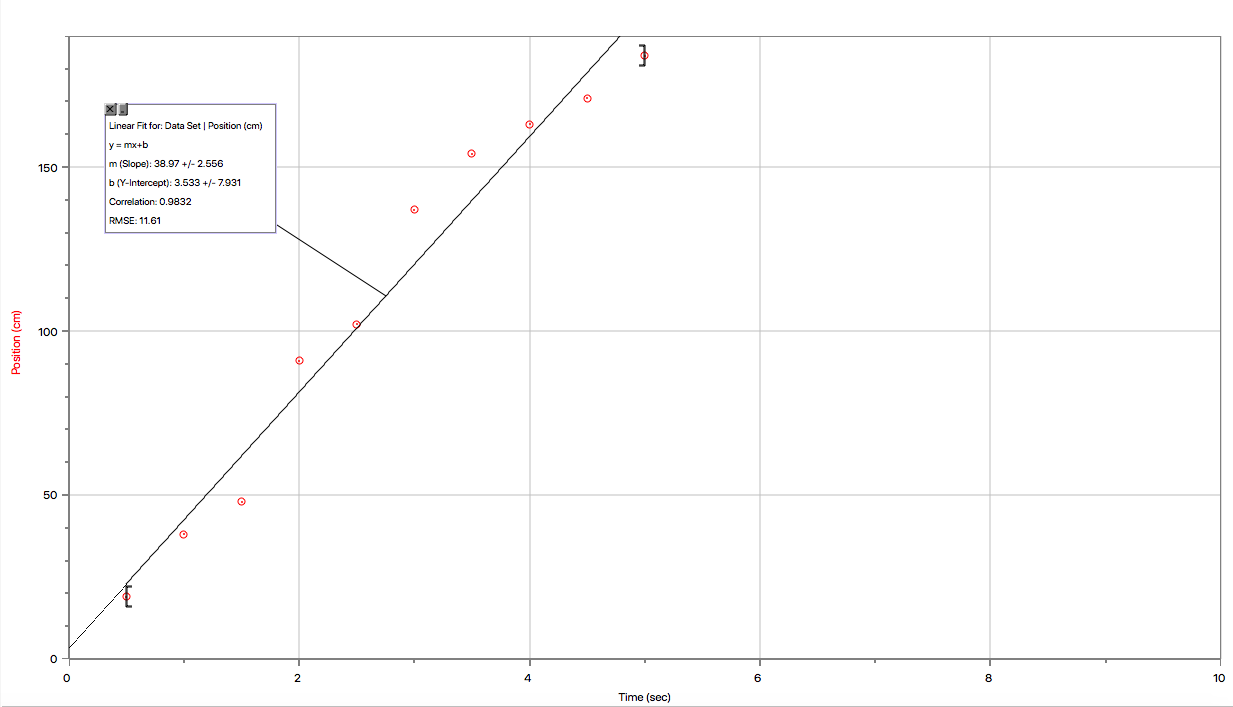
This graph shows the results of the stopwatch trials represented in the position vs time graph. The graph shows a vague linear quality throughout the 11 time intervals used.
Position of Buggy = 38.97(cm/s) * t (sec) + 3.533 (cm)
P(t)=38.97t + 3.533
The y-intercept, 3.533, represents the initial starting position.
Uncertainties: The stopwatch trial includes many uncertainties due to reaction time. The data is not only affected by the person using the stopwatch, but the person stopping the buggy and registering the position of the buggy at the time recorded. A lot of reaction time factors are put into recording the data which creates an uncertainty in the date points, which can clearly be seen on the graph.
Motion Sensor (Trial 2):
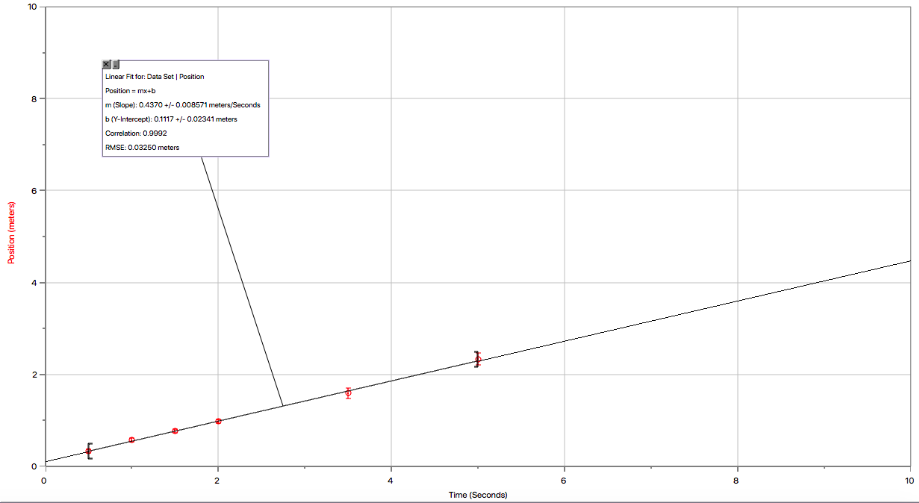
This graph shows the results of the motion sensor trials represented in a position vs time graph. The data collection presents strong linear progression.
Position of Buggy = 0.4320 (m/s) * t (sec) + 0.1134 (m)
P(t) = 0.4320t + 0.1134
Uncertainties: There are none uncertainties as the motion sensor collects many frequent data points which allows even the uncertainty to have no effect over all the other data. Additionally, because it is a great piece of technology, it never fails to be accurate.
Conclusion:
In this experiment, we investigated the relationship between position and time. Through our data collection, we are able to conclude that position is linearly related to time with the buggy. Position and time are directly related as the more time increases, the more the position increases. The slopes derived from the data represent the change in position over the change in time, which can also be known as velocity. With the constant velocity seen in the data, it can be stated that position and time are directly and linearly related. The data collected provides an equation that can be used for all experiments: Position = Velocity * Time + Initial Position.
Evaluation of Procedure:
In the first trial, there were many areas of uncertainty. The reaction time was a huge source of uncertainty for the stopwatch trial. It was practically impossible to get precise data. Between the person using the stopwatch and the person stopping the buggy, the reaction time made the data inaccurate. Additionally, the data taken after it surpassed 2 meters was inaccurate because the meter on the track was not long enough. The buggy was so fast that before it reached 5 seconds, it was past 2 meters. We were not able to measure it properly, therefore, we had to estimate the length which caused our procedure to have flaws.
Improving the Investigation:
With the areas of uncertainty including reaction time and estimated measurements, there are a few ways to improve the investigation. Firstly, we could get rid of the stopwatch trial because it showed to be inaccurate and have many flaws. Secondly, we could use a longer track and/or a second meter stick in order to have accurate results and not have to estimate the position of the buggy after 2 meters. Lastly, we could use slow-motion videos for the video analysis in order to get more data points and more accurate data.
