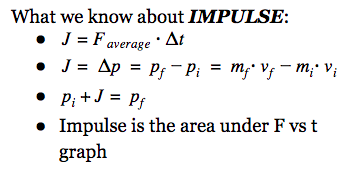
What is Going to be Proven in this Lab:
Lab Materials + Setup:
Procedure:
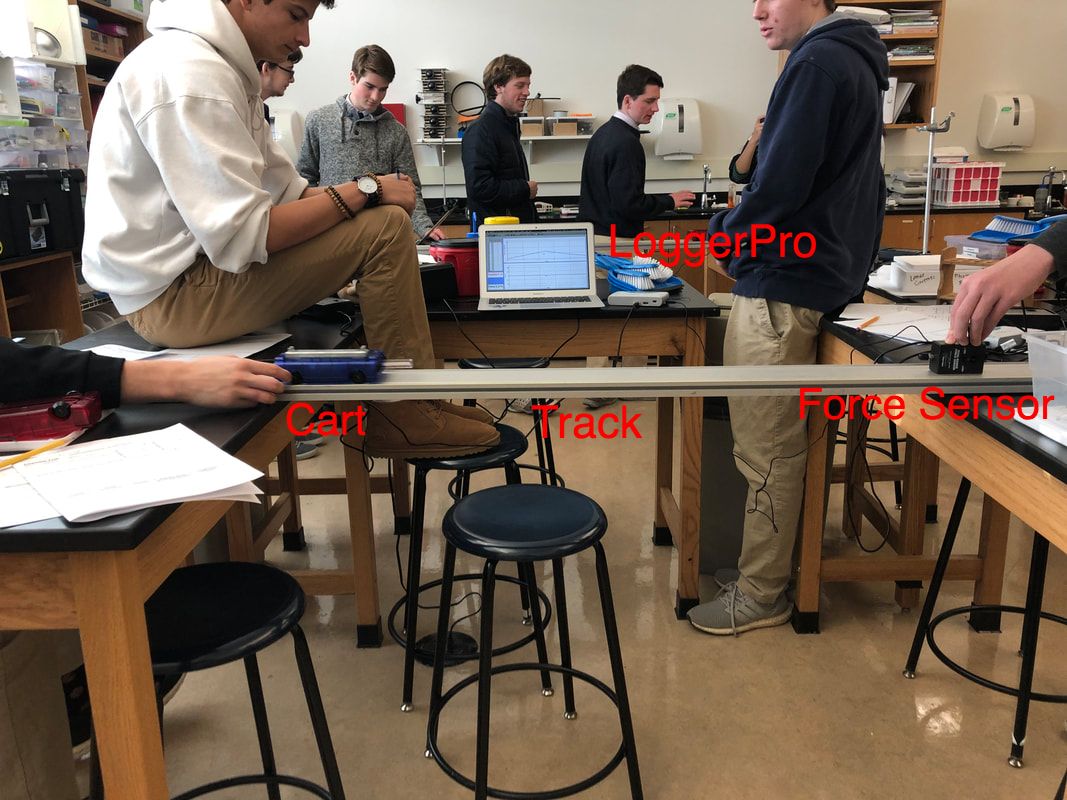
To test if impulse is really the area under a force vs time graph, the average force over a period time, and most importantly change in momentum, we need to carry out an experiment to measure the force over a period of time. We created an experiment in which a cart will be pushed towards a force sensor to record the force the cart had. To do this, you must:
1. Make sure track is balanced and not uneven (must be 0 degrees)
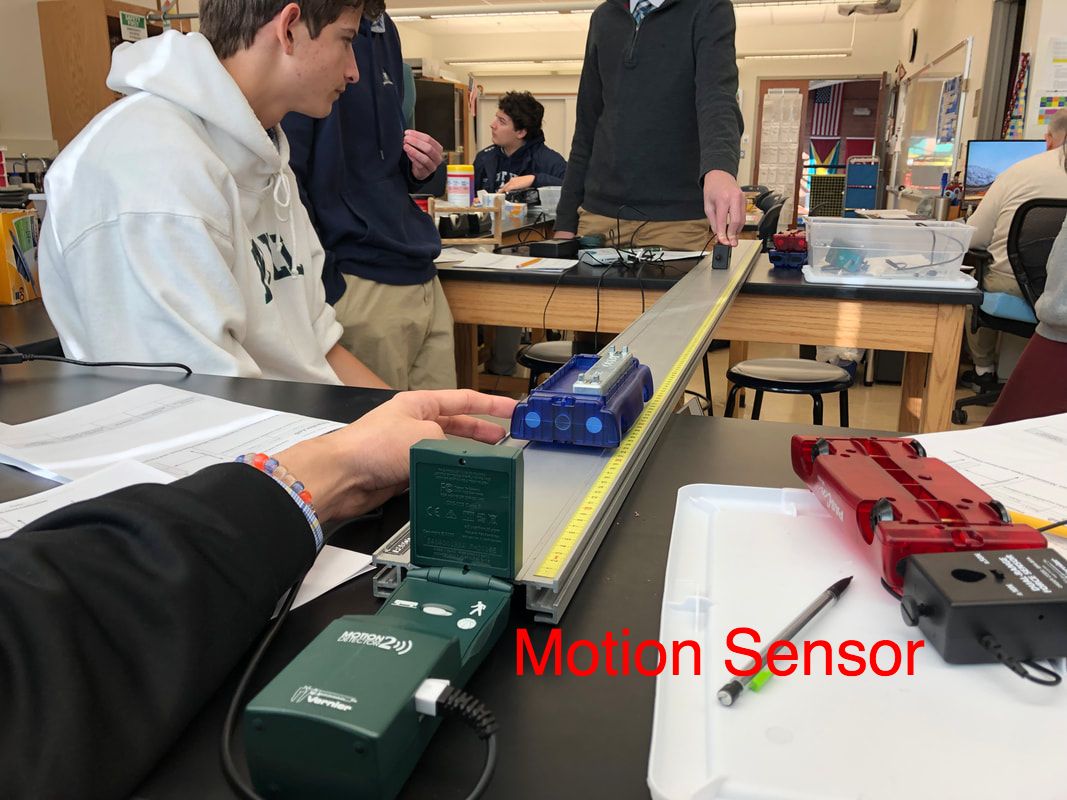
2. Put the motion sensor at the beginning of the track, as shown in the picture .
3. Place the force sensor at the other of the track so that the actual sensor is facing the cart. Also, make sure the force sensor is held tightly so that it does not record inaccurate results.
4. Release the plunger of the cart so that it is sticking out and ready to hit the force sensor. Roll the cart away from the motion sensor and record it simultaneously with LoggerPro. You should have a velocity vs time graph as well as a position vs time graph.
5. Record the data from the force sensor and use it with the data collected through LoggerPro.
1. Make sure track is balanced and not uneven (must be 0 degrees)
2. Put the motion sensor at the beginning of the track, as shown in the picture .
3. Place the force sensor at the other of the track so that the actual sensor is facing the cart. Also, make sure the force sensor is held tightly so that it does not record inaccurate results.
4. Release the plunger of the cart so that it is sticking out and ready to hit the force sensor. Roll the cart away from the motion sensor and record it simultaneously with LoggerPro. You should have a velocity vs time graph as well as a position vs time graph.
5. Record the data from the force sensor and use it with the data collected through LoggerPro.
Graphical Analysis
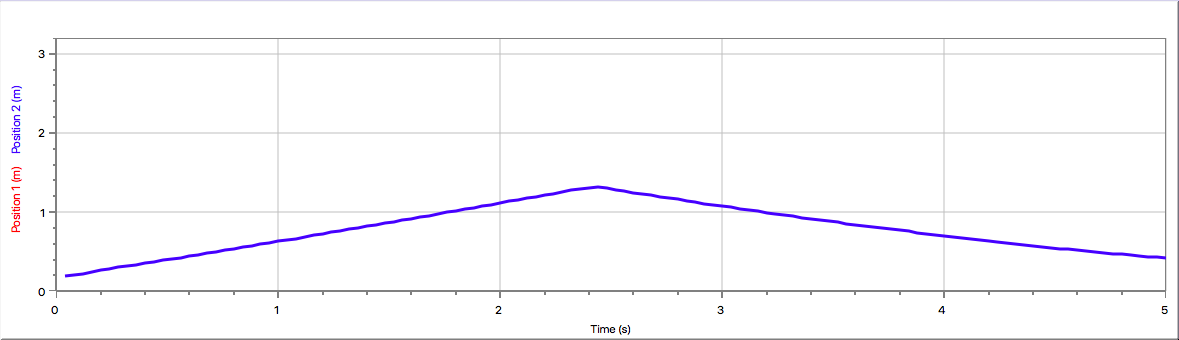
Position vs Time Graph
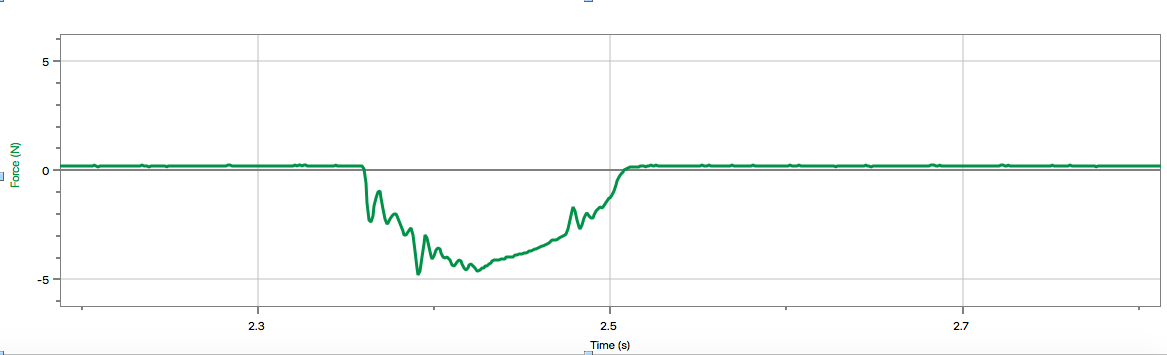
Force vs Time Graph
|
|
Velocity vs Time Graph: Red Line Momentum vs Time Graph: Blue Line Link to Graph: https://www.desmos.com/calculator/ayvydbktbm |
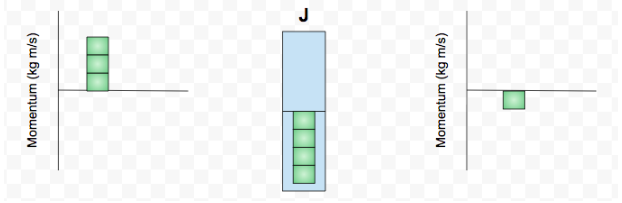
Initial momentum must be positive because it is moving away from the motion sensor. The force sensor gives a negative impulse because it sends the cart in a backwards direction. It has less momentum after because it slowed down from the impact.
Calculations:
Initial Momentum: Initial Velocity * Mass = 0.501kg * 0.477m/s = 0.238977 kgm/s
Final Momentum: Final Velocity * Mass = 0.501kg * -0.355m/s = -0.177855 kgm/s
Impulse (change in momentum): Final Momentum - Initial Momentum = -0.416832 kgm/s
Impulse from Force vs Time Graph: Area under graph = -0.3783 kgm/s
Percent Difference: |-.416832+0.3783| / 0.3783 = 1.01%
Final Momentum: Final Velocity * Mass = 0.501kg * -0.355m/s = -0.177855 kgm/s
Impulse (change in momentum): Final Momentum - Initial Momentum = -0.416832 kgm/s
Impulse from Force vs Time Graph: Area under graph = -0.3783 kgm/s
Percent Difference: |-.416832+0.3783| / 0.3783 = 1.01%
Conclusion:
The aim of this experiment was to prove that the impulse equations we learned in class were in fact accurate and verifiable. We learned that impulse is equal to the area under the Force vs Time Graph, the change in momentum, and the average force over a period of time. We did this by pushing the cart, that had a plunger at the front, away from a motion sensor into a force sensor in which it would then bounce back towards the motion sensor again. We recorded the position and force vs time graphs. The position vs time graph gave me the initial velocity of 0.477m/s by finding the slope before the cart changed directions. I was able to find the final velocity by finding of the slope of the position vs time graph when it was moving in a negative direction, which was -0.355m/s. The mass of the cart was 0.501kg which helped us find the initial and final momentum. We plugged the values into the formula P=mv. This left us with an impulse value -0.416832 kgm/s. To find if the area under a Force vs Time Graph was equal to the impulse, we used the force graph that LoggerPro had recorded from the experiment. The area under it was equal to -0.3783 kgm/s. This left a 1.01% value difference. Since this percentage is exceptionally small, it is safe to claim that the data effectively proves that impulse is equal to change in momentum and the area under a force vs time graph.
Areas of Uncertainty:
The 1.01% difference in impulse values could have stemmed from a variety of errors. We completely disregarded the presence of friction in the lab, even though the cart is designed to have low friction. The friction could have has a very small effect over the outcome of the data. In addition, the force sensor seemed to have little spikes in the data which could result in inaccurate results because it does not represent a perfect parabola.
Widget is loading comments...
